VCT Sync
A mobile experience designed for Valorant Champions Tour fans who want structured match insights without clutter or distraction.
Overview
VCT Sync is a mobile esports companion designed for Valorant Champions Tour fans who want fast, meaningful match insight without clutter. While existing platforms emphasize dense statistics and aggressive monetization, VCT Sync prioritizes clarity, momentum, and mobile scan speed.
The goal is not simply to show who won, but to help fans quickly understand what changed the match and why it mattered.
1. Empathize
Understanding the Esports Viewing Experience
Valorant Champions Tour matches occur across different regions and time zones, making it difficult for fans to follow every game live. To understand how viewers currently track tournament progress, I conducted short interviews with several esports fans who regularly follow competitive Valorant.
Participants described relying on a mix of sources such as tournament websites, Liquipedia pages, social media updates, and live streams to stay informed. While these platforms provide detailed information, they often require navigating multiple pages to access basic details like match results, schedules, and team statistics.
Many participants mentioned that they frequently check match updates while multitasking during work, school, or gameplay. Because of this, they prefer interfaces that allow them to quickly glance at essential information rather than navigating complex tournament pages.
Another consistent insight was that users rarely follow every match in a tournament. Instead, they often track specific teams they care about, checking schedules primarily to see when those teams are playing.
These conversations revealed an opportunity to design an experience that focuses on speed, clarity, and team-centered viewing.
Participants
I spoke with three VCT fans with different viewing habits:
- Participant A: Watches most matches live, cares about bracket implications
- Participant B: Watches highlights and checks scores between classes
- Participant C: Ranked player, uses stats to learn and improve
Method
Semi-structured interviews plus task walkthroughs on mobile. I asked participants to use their current apps and talk out loud while completing the same tasks.
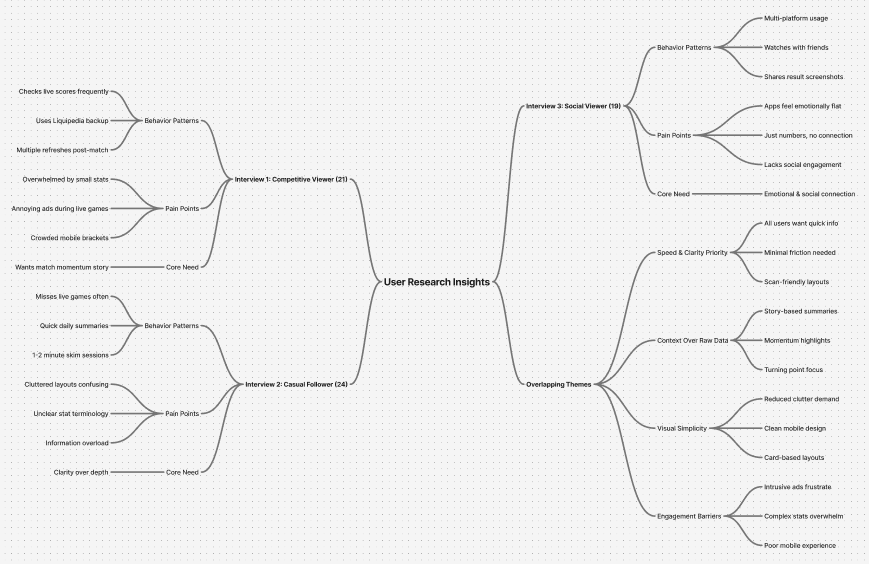
Research synthesis
Affinity mapping of interview notes surfaced three core themes:
- Fans want contextual storytelling, not just final scores
- Intrusive ads damage trust and interrupt focus
- Dense layouts increase cognitive load during quick check-ins
2. Define
Identifying the core problem
Esports fans need a faster and more focused way to track matches, follow their favorite teams, and understand tournament progress without navigating complex tournament interfaces.
Design goals
- Improve scanability – quickly identify matchups, scores, and upcoming matches.
- Support team-centered navigation – enable fans to follow specific teams easily.
- Reduce information overload – prioritize essential match information while keeping deeper statistics accessible.
3. Ideate
With a clearer understanding of the problem space, I began exploring ways to structure esports information within a mobile interface. Early brainstorming focused on organizing match information into patterns that would support quick browsing. Several layout concepts were explored, including list-based views, simplified bracket diagrams, and card-based match displays. Through this exploration, the card-based match layout emerged as the most effective solution. Cards allow match information such as team names, scores, and match times to be grouped into a single visual component, making it easier for users to scan multiple matches quickly.
Additional ideas explored during this phase included:
- Simplifying tournament bracket structures
- Highlighting match results visually
- Allowing users to prioritize favorite teams
4. Prototype
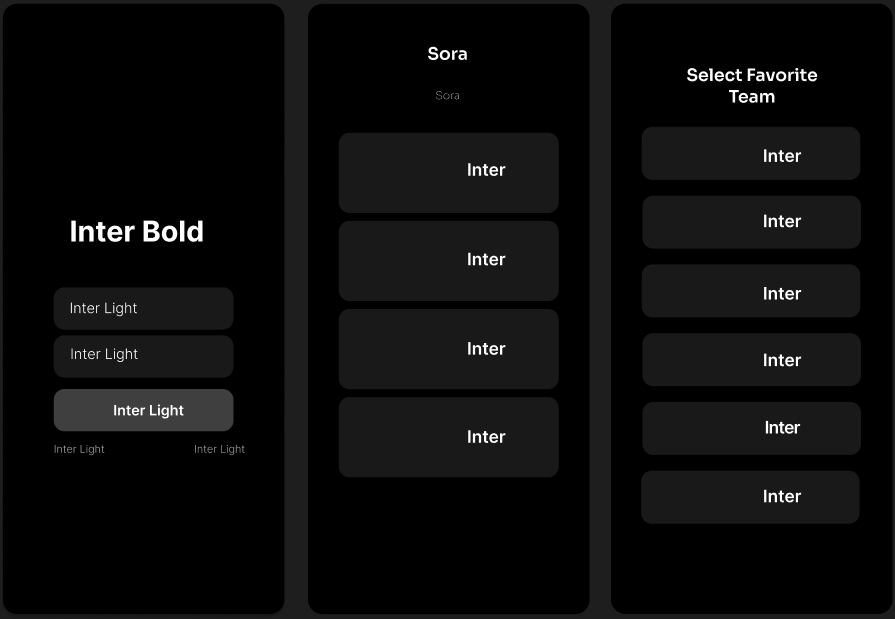
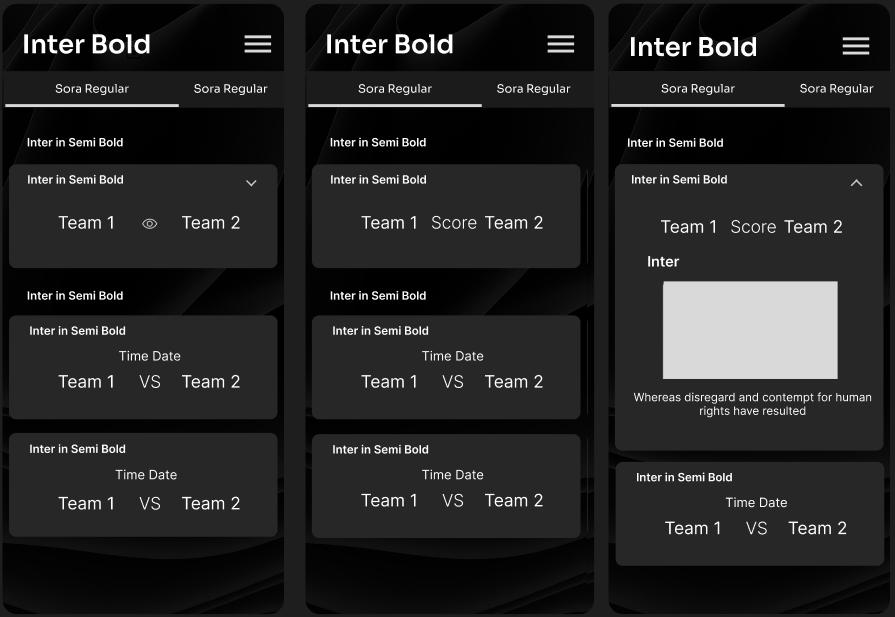
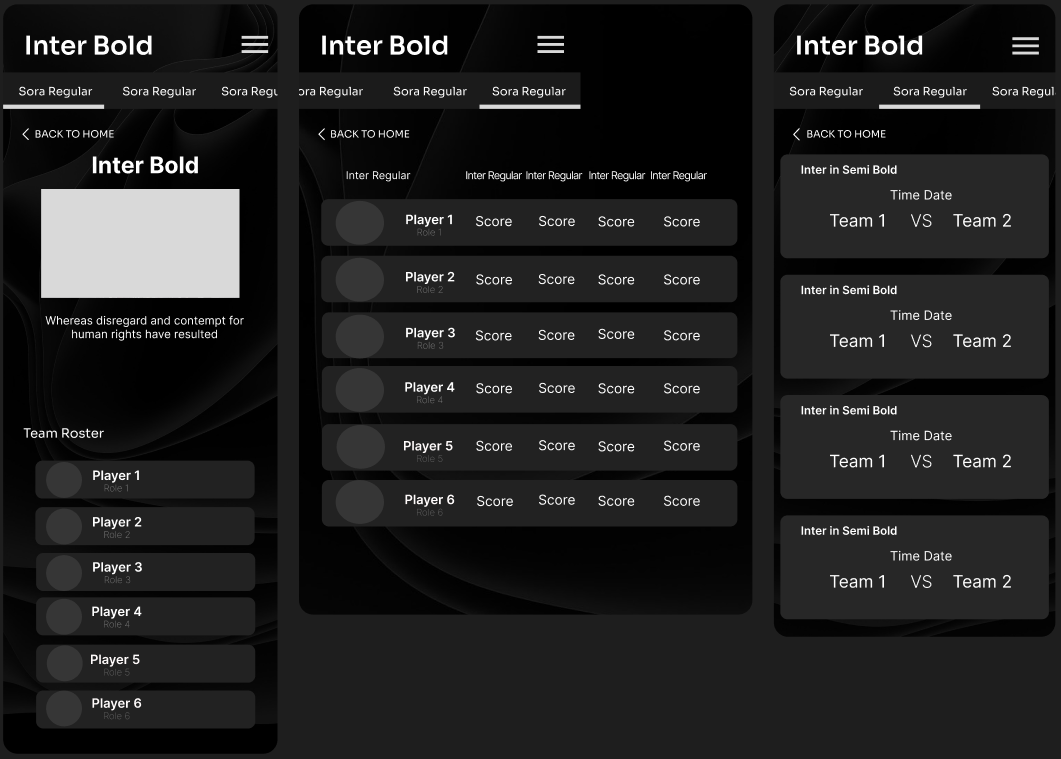
After narrowing down the most promising ideas, I developed mid-fidelity wireframes to refine the structure and interaction flow of the application. At this stage, the focus shifted toward establishing clear information hierarchy and repeatable interface patterns. Match cards were introduced as the primary container for tournament data. Each card displays team matchups, scores, and match timing in a format that allows users to quickly scan through multiple matches. To support readability, I established a typography hierarchy using the Inter typeface:
- Bold weights for section headers
- Semi-bold weights for team names and matchups
- Regular weights for supporting information such as match time and statistics
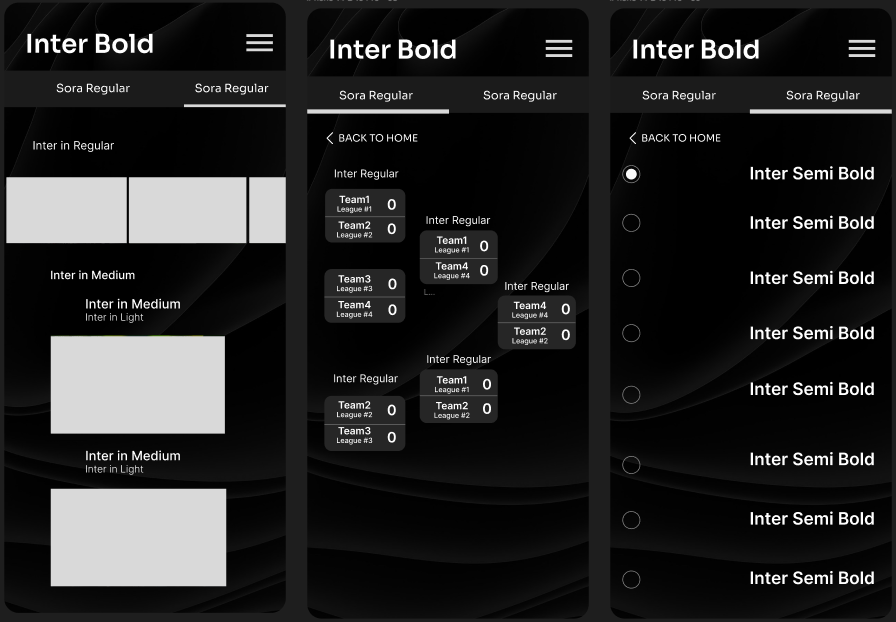
Mid-fidelity designs intentionally removed team logos, images, and colors. Instead, placeholders were used to represent visual elements. This allowed the layout and interaction patterns to be evaluated independently from visual styling. These wireframes served as the structural blueprint before introducing branding and visual design in the high-fidelity stage.
Primary flow
- Open the app and land on Live or Recent matches
- Tap a match to see score and momentum story
- Swipe or tap into key moments for context
- Jump into bracket to see what the result changes
- Optional: open deeper stats only if needed
An interactive high-fidelity prototype was developed to test this flow and validate hierarchy decisions.
5. Test
Testing setup
I ran two rounds of task-based walkthrough testing with three participants on mobile to validate design decisions.
Tasks
- Find who won a missed match
- Identify the turning point
- Explain how it affects bracket progression
- Find a team roster and top performer
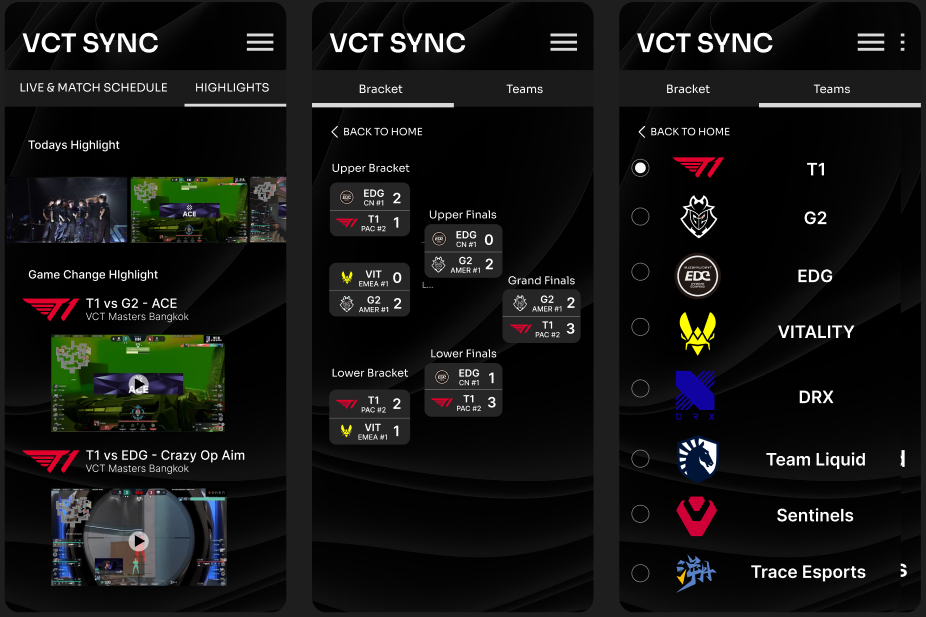
The card-based match layout proved effective for quickly scanning scores and identifying upcoming games. Participants were able to navigate between match lists, team pages, and tournament brackets without confusion. However, testing also revealed several areas for improvement. Some users initially overlooked the bracket navigation option, suggesting that the tournament section needed stronger visual cues. Others suggested clearer distinctions between completed matches and upcoming games.
Improvements
- Participants reached the match outcome faster because score hierarchy was visually dominant
- Participants explained momentum with fewer stops because pivotal rounds were labeled
- Bracket navigation felt clearer after increasing spacing and reducing visual noise
- Users no longer needed to switch platforms to understand match context
Based on this feedback, I refined the layout by improving section labels, adjusting spacing between match cards, and strengthening the visual hierarchy between live matches, upcoming matches, and completed results. These improvements helped ensure the interface remained easy to navigate while supporting both quick score checking and deeper exploration of tournament data.
Next tests
- Validate spoiler mode behavior with more users
- A/B test two momentum layouts: timeline vs. key moments list
- Evaluate where monetization can exist without interruption
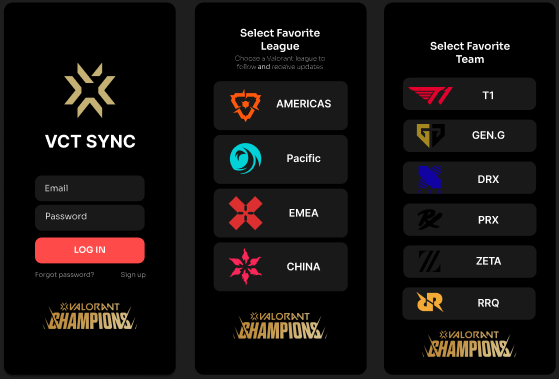
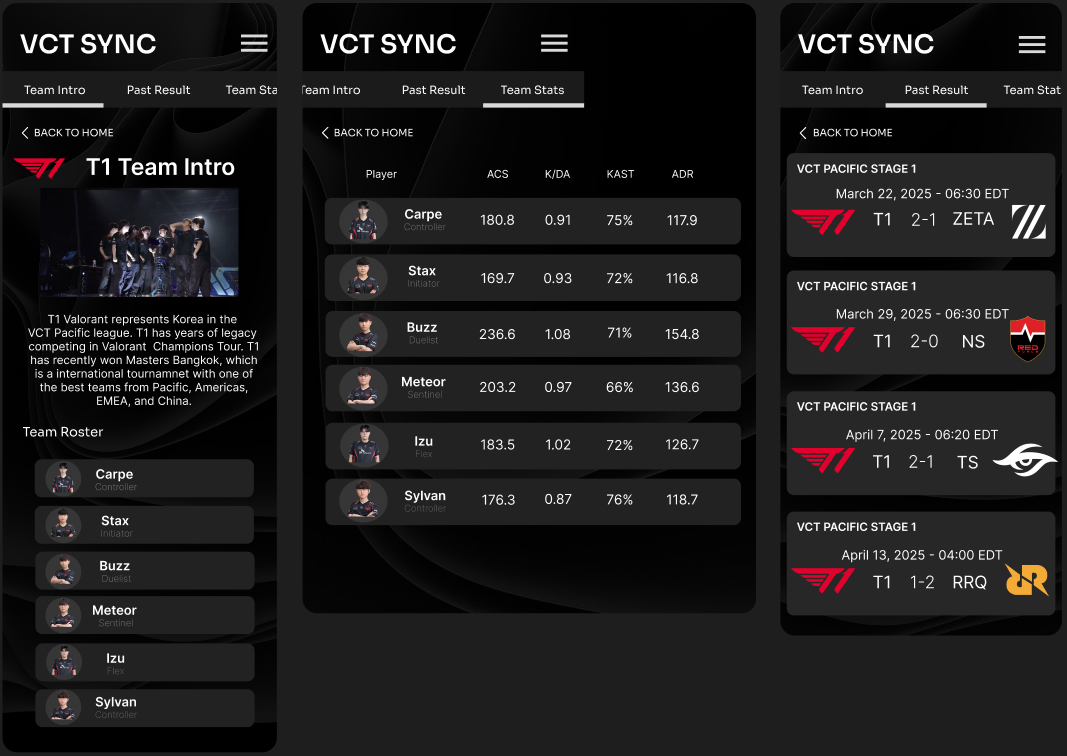
With the structural layout validated through mid-fidelity testing, I moved into high-fidelity design. This stage introduced team branding, esports-inspired visual elements, and a darker interface theme designed to emphasize match information while maintaining readability. The final design preserves the clear information hierarchy established during wireframing while creating a more immersive and visually engaging experience for esports fans.
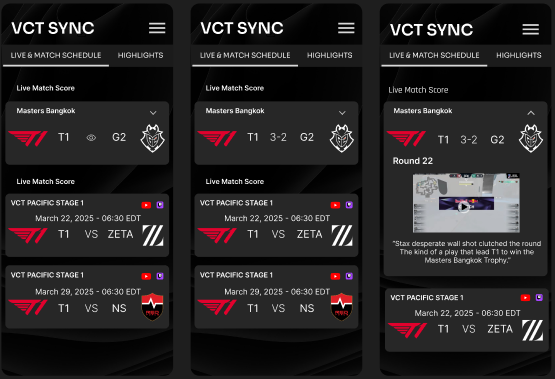
Iteration example: match hierarchy
Initial observation
In early versions, the live match screen displayed score and stats with similar visual weight. During walkthrough testing, participants immediately located the score but hesitated when identifying key momentum shifts.
Design adjustment
To address this, I:
- Increased visual emphasis on pivotal round markers
- Reduced competing stat density in the primary view
- Strengthened contrast hierarchy between score and secondary data
Result
Participants were able to describe the match flow faster and reported that the layout felt more focused and less overwhelming.
Constraints and tradeoffs
- No official live data integration. Because this was a concept project without direct API access, the design had to assume limited real-time data control. This influenced the decision to prioritize clarity and summary views over complex stat dashboards.
- Balancing depth and simplicity. Hardcore fans want depth, while casual viewers want speed. Instead of overloading the main interface, progressive disclosure ensures deeper stats appear only when requested.
- Spoiler sensitivity. Some users prefer immediate full results, while others avoid spoilers. The design explores spoiler-aware navigation to accommodate both behaviors.